MiniStats
MiniStats is a lightweight performance overlay for PlayCanvas applications. Use it to watch frame time, draw calls, CPU and GPU timings, and estimated GPU resource memory while interacting with your scene. To collect measurements from code without an overlay, use AppStats.
This page describes the MiniStats interface in Engine 2.23 and later.
Enabling MiniStats
Editor users can enable MiniStats from the Launch button menu:
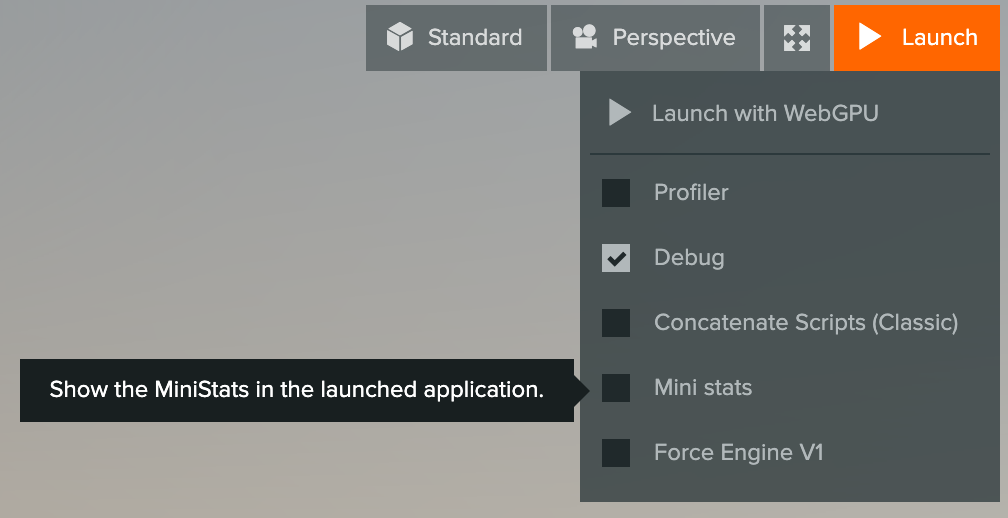
In a standalone application, create the overlay after initializing the application:
import { MiniStats } from 'playcanvas';

const miniStats = new MiniStats(app);
When using a script-tag build, use new pc.MiniStats(app) instead. MiniStats enables GPU profiling when its GPU counter is enabled, subject to device support.
Display Sizes
Click or tap outside the section headings to cycle through three default views. You can also focus the overlay and press Enter or Space.
| View | Contents |
|---|---|
| Compact | Core counters with averaged numeric values. |
| Medium | Collapsible Engine, User, CPU, GPU and VRAM sections with averaged values. No graphs or peak column. |
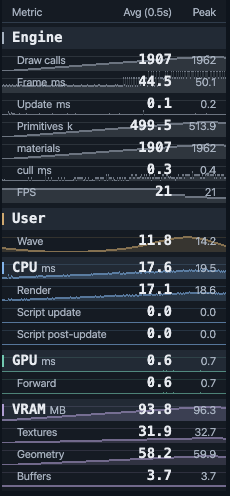
| Large | The same groups with graph history behind the text, plus averages and peaks. |
Sections appear in the order Engine, User, CPU, GPU and VRAM. If the list is taller than the screen, scroll with the mouse wheel or drag on a touch screen. All sections scroll beneath the fixed column labels, including Draw calls and Frame.
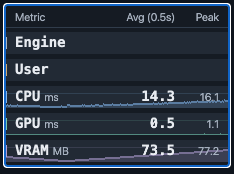
The large view with sections expanded and collapsed:
| Expanded | Collapsed |
|---|---|
 |  |
Collapsing Sections
In the medium and large views, click or tap a section heading to hide or show its counters. Sections start expanded. The heading stays visible when collapsed; CPU, GPU and VRAM also keep their total values. Engine and User have no total because their counters can use different units.
| Section | Contents |
|---|---|
| Engine | Built-in counters configured in options.stats, starting with Draw calls and Frame. Additional engine counters such as Update, FPS, primitive counts and splat counts also belong here. |
| User | Counters whose configured paths all start with user., reading from app.stats.user. In the example, only Wave belongs here. |
| CPU, GPU, VRAM | Their totals and available timing or memory breakdowns. |
Engine and User are omitted when they have no configured counters. Collapsing a section keeps sampling and graph history running. Its state survives size changes, but compact mode shows individual counters without section headings and ignores collapsed state.
Control the same state from code with these read/write boolean properties:
miniStats.engineCollapsed = true;
miniStats.userCollapsed = true;
miniStats.cpuCollapsed = true;
miniStats.gpuCollapsed = true;
miniStats.vramCollapsed = true;

// Expand GPU details again.
miniStats.gpuCollapsed = false;
All five properties default to false and stay synchronized with heading clicks. They can also be set while the overlay is compact, before detailed counters are shown. Unlike miniStats.enabled = false, collapsing a section does not stop its measurements.
Averages, Peaks and History
By default, the numeric values refresh approximately twice per second. Avg (0.5s) is the arithmetic mean of the frame samples collected since the previous refresh. Peak is the largest sample in that same interval, not an all-time maximum. Compact values use the same averaging window even though the column heading is hidden.
After each refresh, a new collection window starts. This is not a continuously sliding average. textRefreshRate controls the window in milliseconds; changing it also changes the heading. A window completes on a frame boundary, so it can be slightly longer than the configured interval.
In the large view, graph history samples every application frame, independently of the text refresh. The visible history therefore covers a different amount of time at different frame rates. GPU samples use the latest asynchronously resolved result and can repeat while waiting for a newer result.
Basic Statistics
The default configuration includes these counters:
| Metric | Meaning |
|---|---|
| Draw calls | Draw commands submitted per frame, including additional passes such as shadows and post-processing. This is not an object count. |
| Frame | Interval between application ticks in milliseconds, including browser scheduling and waiting outside the engine. It is not just time spent executing engine code. A steady 60 FPS corresponds to about 16.67 ms; 30 FPS to 33.33 ms. |
| CPU | CPU duration measured across the engine's frame update and render events. This measures elapsed time, not CPU utilization as a percentage. |
| GPU | Overall elapsed GPU frame duration in milliseconds, when supported. This is not GPU utilization or a sum of all pass durations. |
| VRAM | Estimated memory occupied by tracked textures and GPU buffers. The overlay labels this MB and uses 1,048,576 bytes per unit (MiB). |
CPU and GPU work can overlap. Adding CPU and GPU durations does not give the Frame value. MiniStats' overall CPU timer also has different boundaries from the AppStats.cpuUpdateTime and cpuRenderTime measurements; their sum need not match the overlay's CPU row.
Detailed Timing Mode
When expanded, the CPU, GPU and VRAM sections in medium and large views include their totals and available sub-counters.
CPU Sub-Timings
| Row | Meaning |
|---|---|
| Render | CPU time preparing and submitting rendering, including prerender/postrender listeners, hierarchy synchronization and batching. It does not measure GPU execution. |
| Script update | The component systems update phase, including script update callbacks, physics and other subscribed systems. It is not limited to user scripts. |
| Script post-update | The component systems post-update phase, including script postUpdate callbacks. |
| Animation | The dedicated animation-update phase used by AnimComponentSystem. Legacy animation components run in the system update phase. |
| Physics | The most recent physics step, including synchronization and contact handling. Normally included in Script update. |
| Splat sort | Gaussian splat sorting time reported by a worker. This is separate from main-thread CPU time. |
Do not add all the rows together: phases can overlap or contain other phases, and worker measurements describe work on another thread. Animation, Physics and Splat sort rows appear once they have a positive value.
GPU Pass Timings
On WebGPU, detailed views show individual render and compute pass durations when timestamp queries are supported. Passes with the same name are aggregated into one row. Typical rows include Forward, Downsample, Upsample and Compose, depending on the scene and rendering configuration.
On WebGL 2, PlayCanvas provides an overall frame timing rather than a per-pass breakdown. This is a limitation of PlayCanvas' WebGL profiling implementation, not a restriction that timer queries can only measure entire frames.
GPU results arrive asynchronously and may be several frames old. Pass intervals can overlap on the GPU, so their sum need not equal the overall GPU frame duration.
VRAM Breakdown
| Row | Tracked resources |
|---|---|
| Textures | GPU textures. |
| Geometry | Vertex and index buffers. |
| Buffers | Uniform and storage buffers; this row is shown on WebGPU. |
These are resource estimates for the graphics device, which may be shared by applications. They exclude JavaScript heap memory, untracked driver overhead and total physical GPU memory capacity. Use the AppStats memory getters for individual buffer categories in bytes.
GPU Timing Requirements
| Backend | Requirement |
|---|---|
| WebGL 2 | The EXT_disjoint_timer_query_webgl2 extension. |
| WebGPU | The timestamp-query adapter feature, which the engine requests automatically when available. |
Enabling the overlay cannot add missing device support. An unavailable GPU measurement can appear as zero in MiniStats; do not interpret that as free GPU rendering. app.stats.gpuFrameTime returns undefined when no valid measurement is available.
The default CPU timings, draw call count and memory estimates work in all engine builds, including release and minified builds. Some additional counters require a debug or profiler build; see the availability table.
Customizing the Overlay
Start with the default options and modify them before constructing MiniStats. Passing an incomplete options object does not merge it with the defaults.
import { MiniStats } from 'playcanvas';

const options = MiniStats.getDefaultOptions();
options.startSizeIndex = 2;       // Large view
options.textRefreshRate = 500;   // Averaging window in milliseconds
options.sizes[1].width = 190;     // Medium panel width in CSS pixels
options.sizes[2].width = 260;     // Large panel width in CSS pixels
options.cpu.watermark = 1000 / 60;
options.gpu.watermark = 1000 / 60;

const miniStats = new MiniStats(app, options);
Each size has independent width, row height, spacing, graph visibility, detail and peak settings. A watermark sets the graph's reference budget and vertical scale. The two values above mark a 60 FPS budget; they do not limit execution time.
Additional Counters
Each entry in options.stats resolves numeric property paths relative to app.stats. Use public AppStats getters where available. Multiple paths in one entry are added together. decimalPlaces controls formatting, multiplier scales the sampled value, and unitsName supplies its label.
For example, add these entries to the options before creating the overlay:
options.stats.push({
    name: 'Update',
    stats: ['cpuUpdateTime'],
    decimalPlaces: 1,
    unitsName: 'ms',
    watermark: 1000 / 60
});

// Primitive counts are available only in debug and profiler builds.
if (app.stats.primitiveCount !== undefined) {
    options.stats.push({
        name: 'Primitives',
        stats: ['primitiveCount'],
        decimalPlaces: 1,
        multiplier: 1 / 1000,
        unitsName: 'k',
        watermark: 500
    });
}
Set miniStats.enabled = false to hide the overlay and stop its counter sampling, or call miniStats.destroy() to release it. GPU profiling is a device setting: hiding or destroying the overlay does not turn it off. If nothing else needs GPU timings, disable it separately with app.graphicsDevice.gpuProfiler.enabled = false when that profiler exists.
MiniStats batches the overlay into a mesh and reuses its text atlas. History is collected only for views with graphs. It is designed to keep overhead low, but rendering and GPU queries still have a cost. Keep the same instrumentation enabled for before/after comparisons.
For all options and lifecycle methods, see the MiniStats API reference.
User Counters
Starting with Engine 2.23, app.stats.user provides a Map<string, number> for application-defined counters, such as queue lengths or manually measured CPU timings. The getter always returns the same map, and you can use set, get, delete, and clear to manage its entries. User counters are available in all engine builds.
Add a graph to the options before creating MiniStats. A path such as user.wave reads the map entry named wave; avoid dots in counter names because dots separate path segments. This example displays a value that oscillates between 0 and 20:
import { MiniStats } from 'playcanvas';

app.stats.user.set('wave', 10);

const options = MiniStats.getDefaultOptions();
options.startSizeIndex = 2; // Start with graph history visible
options.stats.push({
    name: 'Wave',
    stats: ['user.wave'],
    decimalPlaces: 1,
    watermark: 20
});
const miniStats = new MiniStats(app, options);

let time = 0;
app.on('update', (dt) => {
    time += dt;
    app.stats.user.set('wave', 10 + 10 * Math.sin(time));
});
The engine does not reset user counters. For a per-frame total, initialize the entry and reset it on frameupdate before accumulating values. To measure synchronous code, use the difference between two performance.now() calls and configure the graph with unitsName: 'ms'. Units are application-defined; MiniStats does not infer them or automatically add graphs for new map entries.
Example
The resource allocation example repeatedly creates and releases entities, materials, vertex buffers and textures. Watch their effect on the counters, click section headings to collapse or expand them, and click elsewhere in the overlay to compare all three views.